Analysis
The Analysis page within principia MBS provides users with a comprehensive toolset to visualize data from multiple simulations, simulation objects, and their components, all amalgamated into a single graph. This functionality empowers users to gain deeper insights into the behavior and interactions of their multibody systems.
Key Features
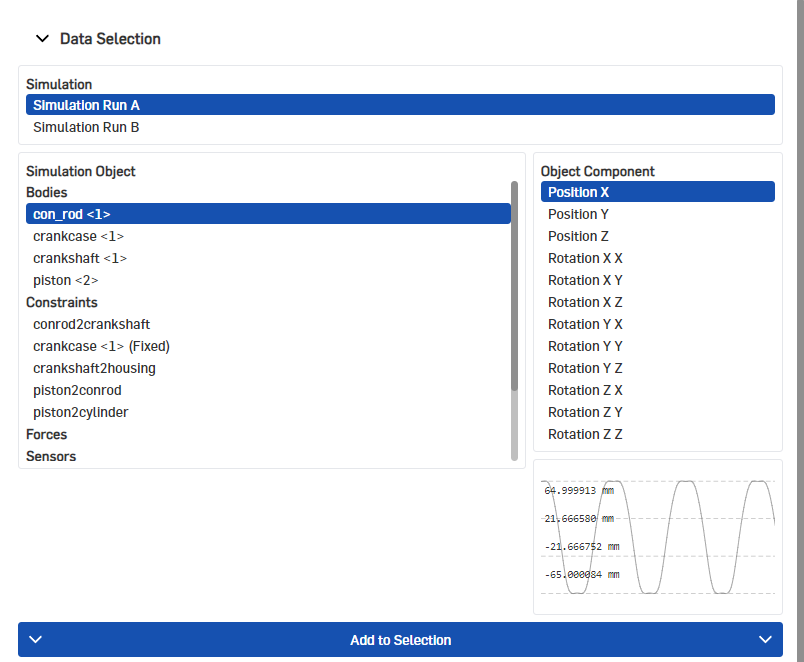
Data Selection
Users can select data from various simulations conducted within principia MBS. The selection extends to individual simulation objects and their specific components, offering granular control over the data to be analyzed. Before sending a data set to the unified graph, users can review the data set in a smaller graph next to the selection boxes.
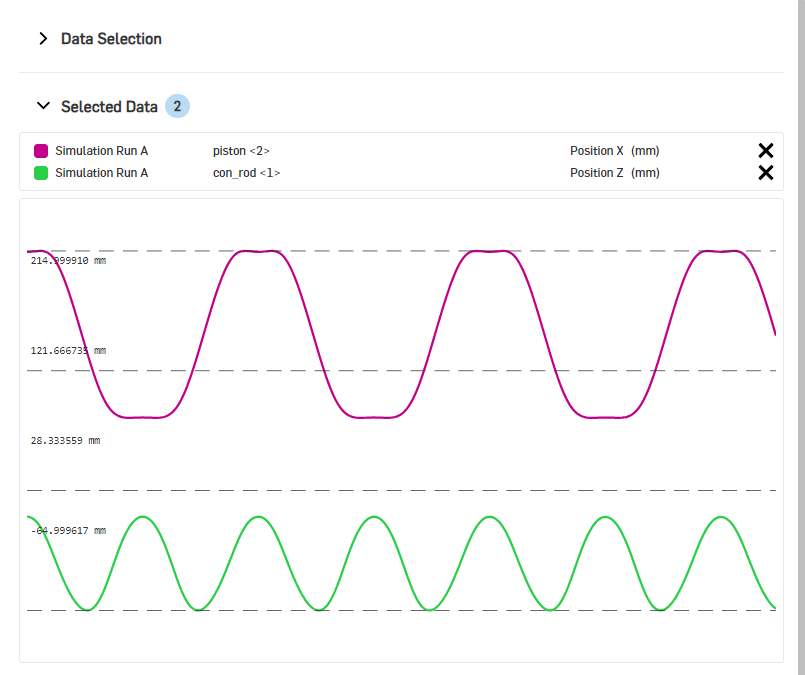
Selected Data
In this section users can review their selected data, remove unnecessary selections, and adjust colours for the individual lines.
Combined Visualization
The Analysis page seamlessly integrates selected data into a unified graph, facilitating easy comparison and correlation. Users can overlay data from different simulations, objects, and components on the same graph, enabling efficient analysis of system behavior under varying conditions. Data sets containing different units are not a problem - principia MBS groups its data by units and adjusts the graph accordingly.